Retail Sales Performance Dashboard
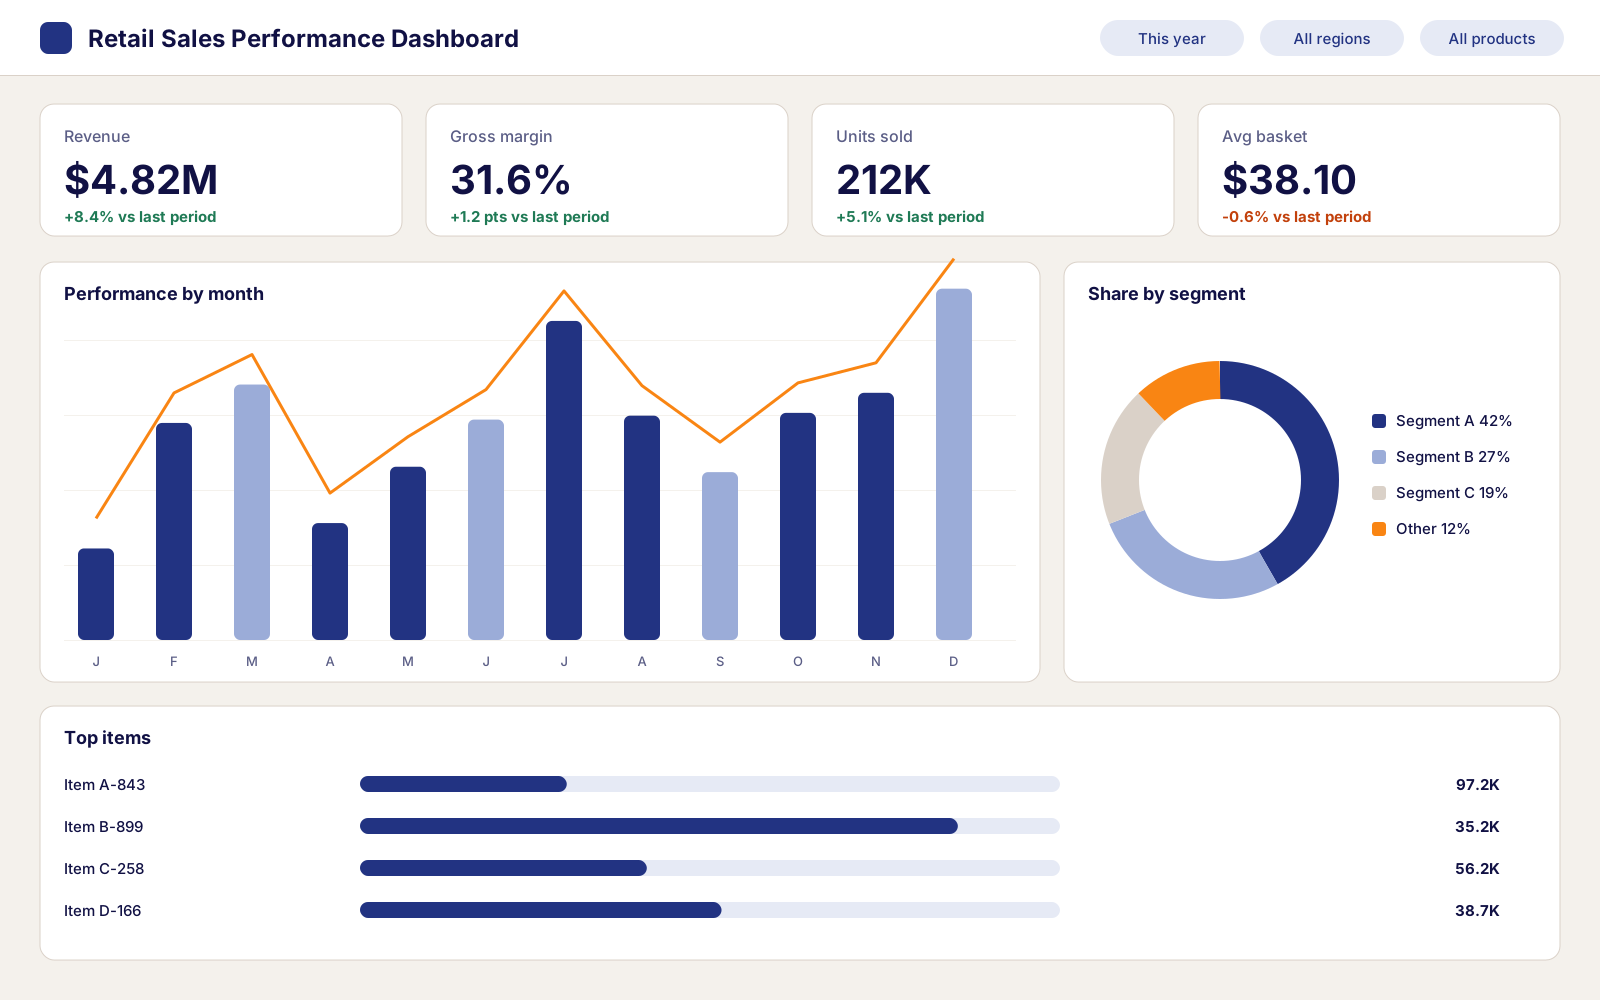
A single Power BI view of sales, margin and stock across 12 stores, designed to replace a weekly Excel pack that takes two days to build.
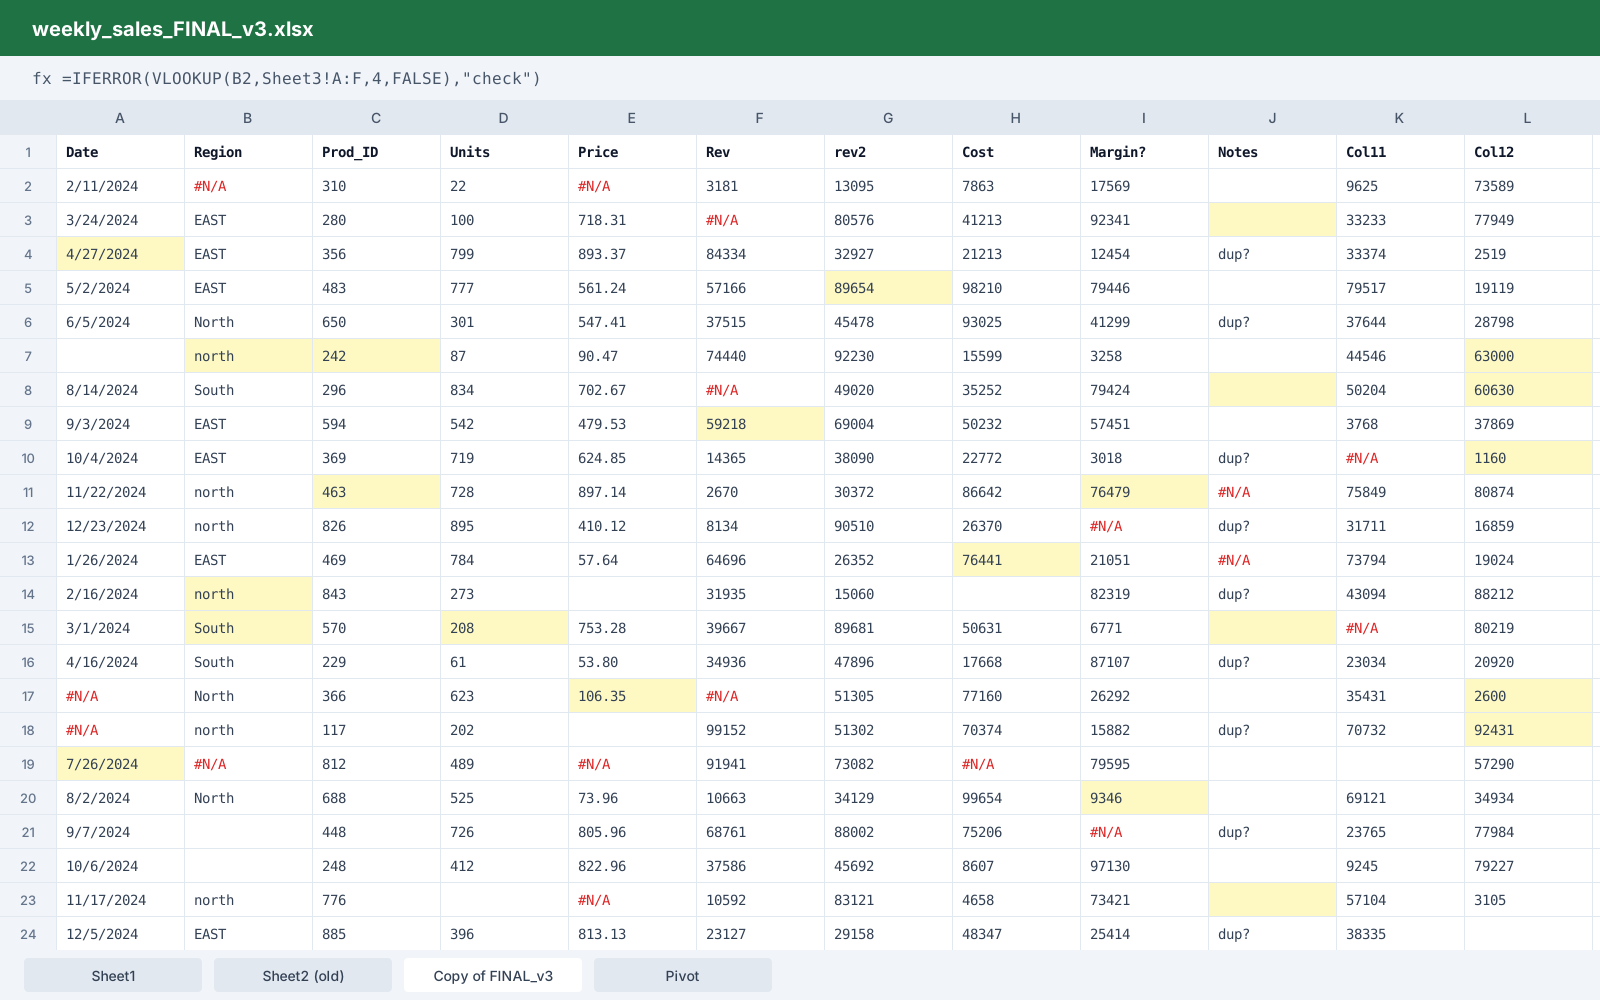
Drag the handle to compare the raw data with the finished dashboard.
12 stores
in one model
40 tabs
of Excel replaced by one report
3 sources
POS, product master and targets joined
The scenario
A retail chain with 12 stores builds its weekly sales report by hand. Every Monday someone exports sales from the POS system, pastes them into a 40-tab workbook and fixes broken formulas. The report is ready on Wednesday, the numbers are already old, and managers argue about which version is right.
The data
Sample point-of-sale transactions in SQL Server, a product master in Excel and monthly store targets. As in most real sources, store names are spelled differently from one file to the next, and about 3% of rows have missing product IDs.
My approach
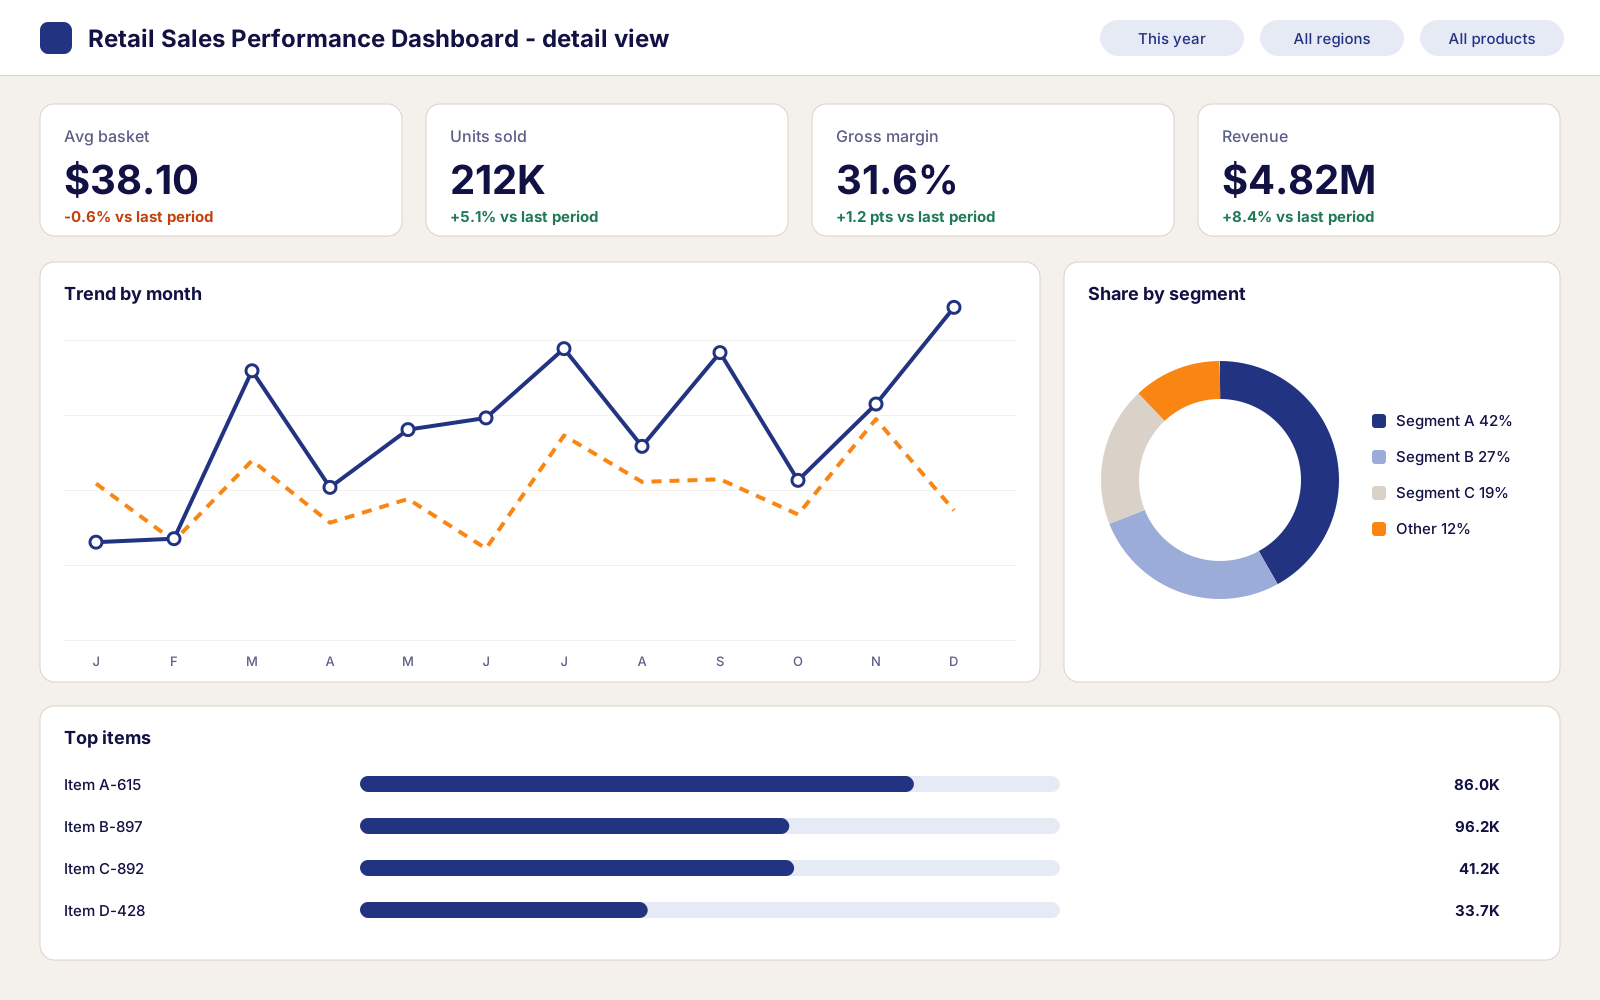
I built a star schema with one sales fact table and shared dimensions for date, store and product. Power Query handles the cleanup, so the messy steps run the same way every time. DAX measures cover year-over-year growth, margin and stock cover, and every page answers one question a store manager would ask.
What it changes
The report refreshes on its own every morning, so managers can check it before opening instead of waiting until Wednesday. The hours spent copying and fixing data can go into reviewing slow-moving products and margin by line.
Dashboard gallery
Hiring, or looking for a BI partner?
I'm open to senior BI and analytics roles and to selected consulting projects. Tell me what you're working on and I'll get back to you within 1 to 2 business days.