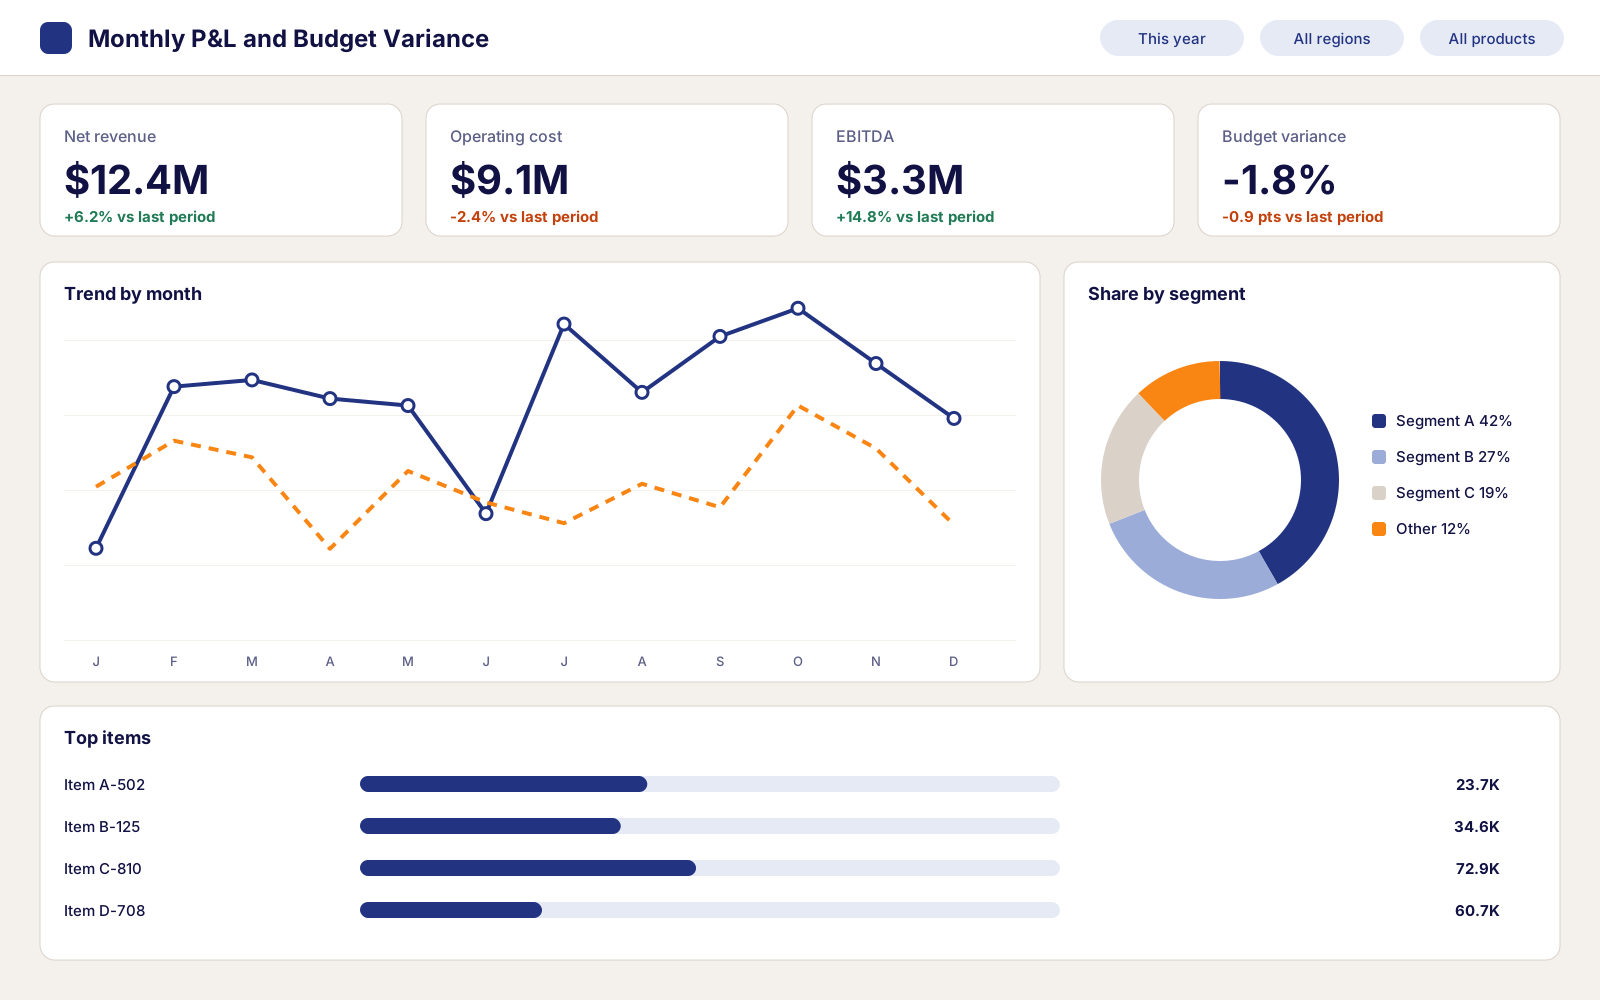
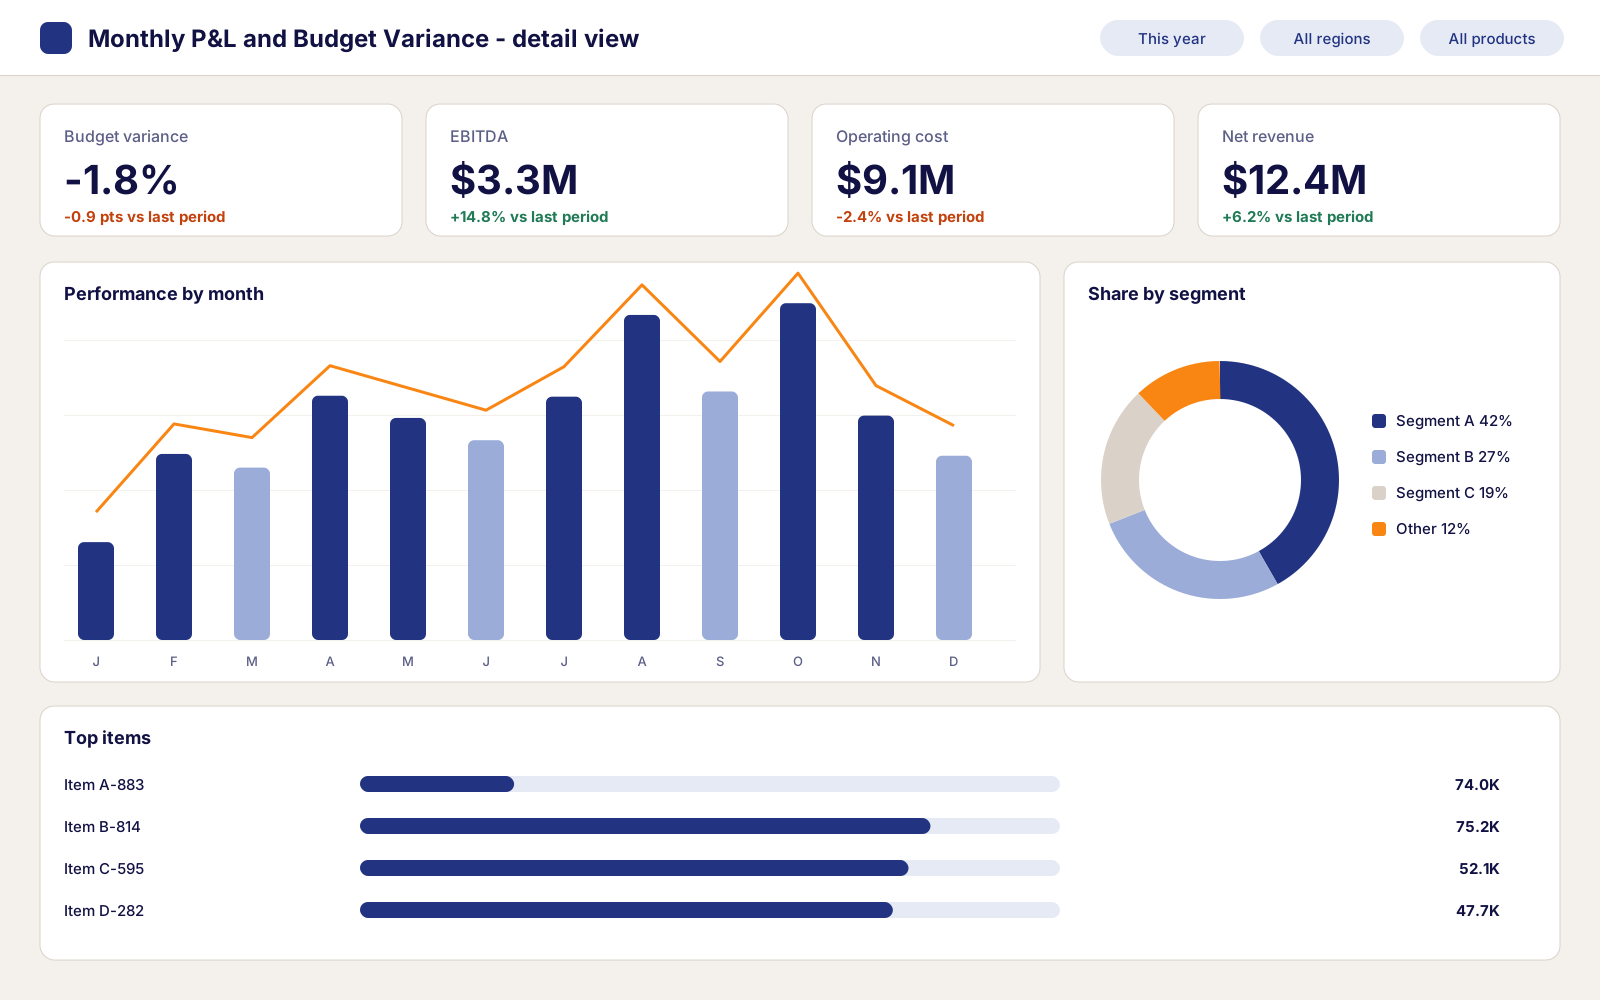
Monthly P&L and Budget Variance
An automated profit and loss report with budget variance by department, designed to cut month-end reporting from five days to one.
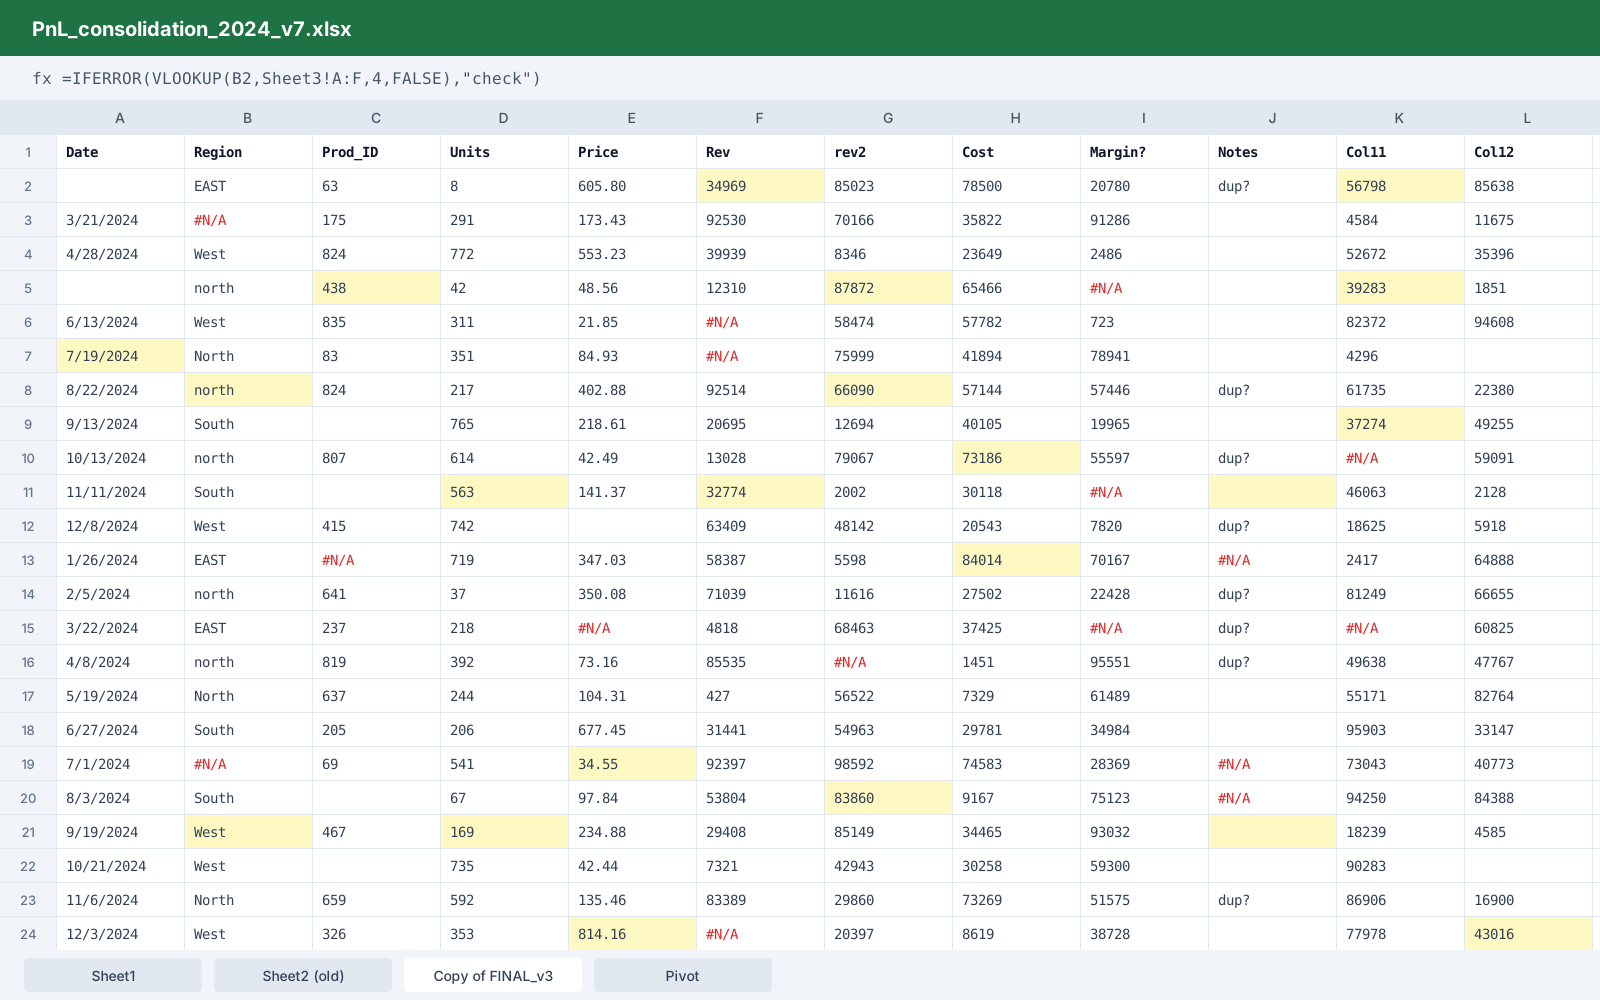
Drag the handle to compare the raw data with the finished dashboard.
40+
departmental files merged into one model
3 views
actuals, budget and forecast side by side
1 measure
for variance at every level
The scenario
A company consolidates more than 40 departmental spreadsheets every month. Each one has its own layout, so one broken link can delay the whole pack. Leadership only sees the final PDF, with no way to drill into a number.
The data
Sample general ledger exports, a chart of accounts mapping, departmental budgets in Excel and an exchange rate table. The account codes change twice over two years, so history needs a mapping layer.
My approach
I standardised the inputs with Power Query and built a mapping table that translates old account codes to the current structure. The model separates actuals, budget and forecast, and one variance measure works at every level, from company total down to a single account.
What it changes
The manual consolidation that takes up most of the five-day close is automated, so the pack can be ready in a day. Department heads can open the report and drill into their own variance before the review meeting, so everyone starts from the same numbers.
Dashboard gallery
Hiring, or looking for a BI partner?
I'm open to senior BI and analytics roles and to selected consulting projects. Tell me what you're working on and I'll get back to you within 1 to 2 business days.